Introduction
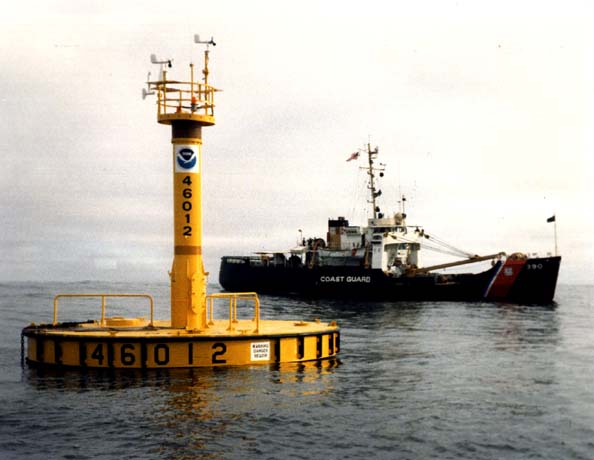
Ocean buoys are one of the most valuable tools for anticipating surf heights since buoys measure waves in real time. For many areas around the world, buoys that measure wave heights are scarce. In the United States, however, there is an abundance of buoys scattered around the US coastlines, managed by the National Data Buoy Center (NDBC) and other science institutions. Understanding the data reported from buoys can be very helpful in anticipating what to expect at your local beach.
Wave Spectrum
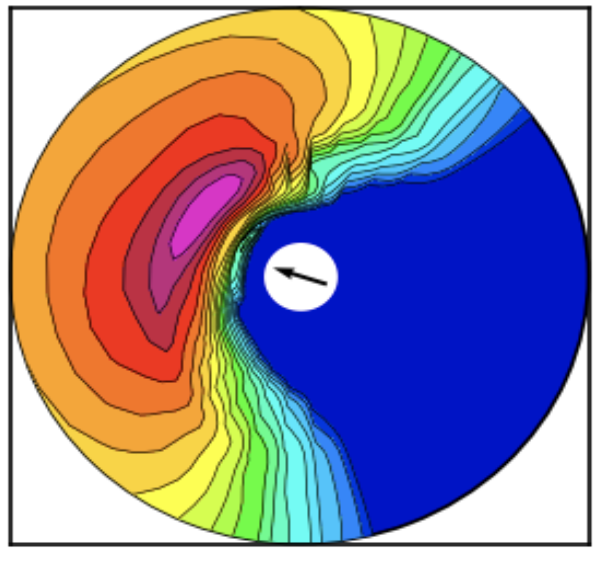
It is important to understand that at a given buoy, there are waves coming from all different directions, heights, and frequencies. This complete view of wave energy is called the wave spectrum. The data reported from a buoy is derived from this wave spectrum. Below is an image that illustrates the magnitude of wave energy across the 360 degree wave spectrum.
Significant wave height and dominant wave period
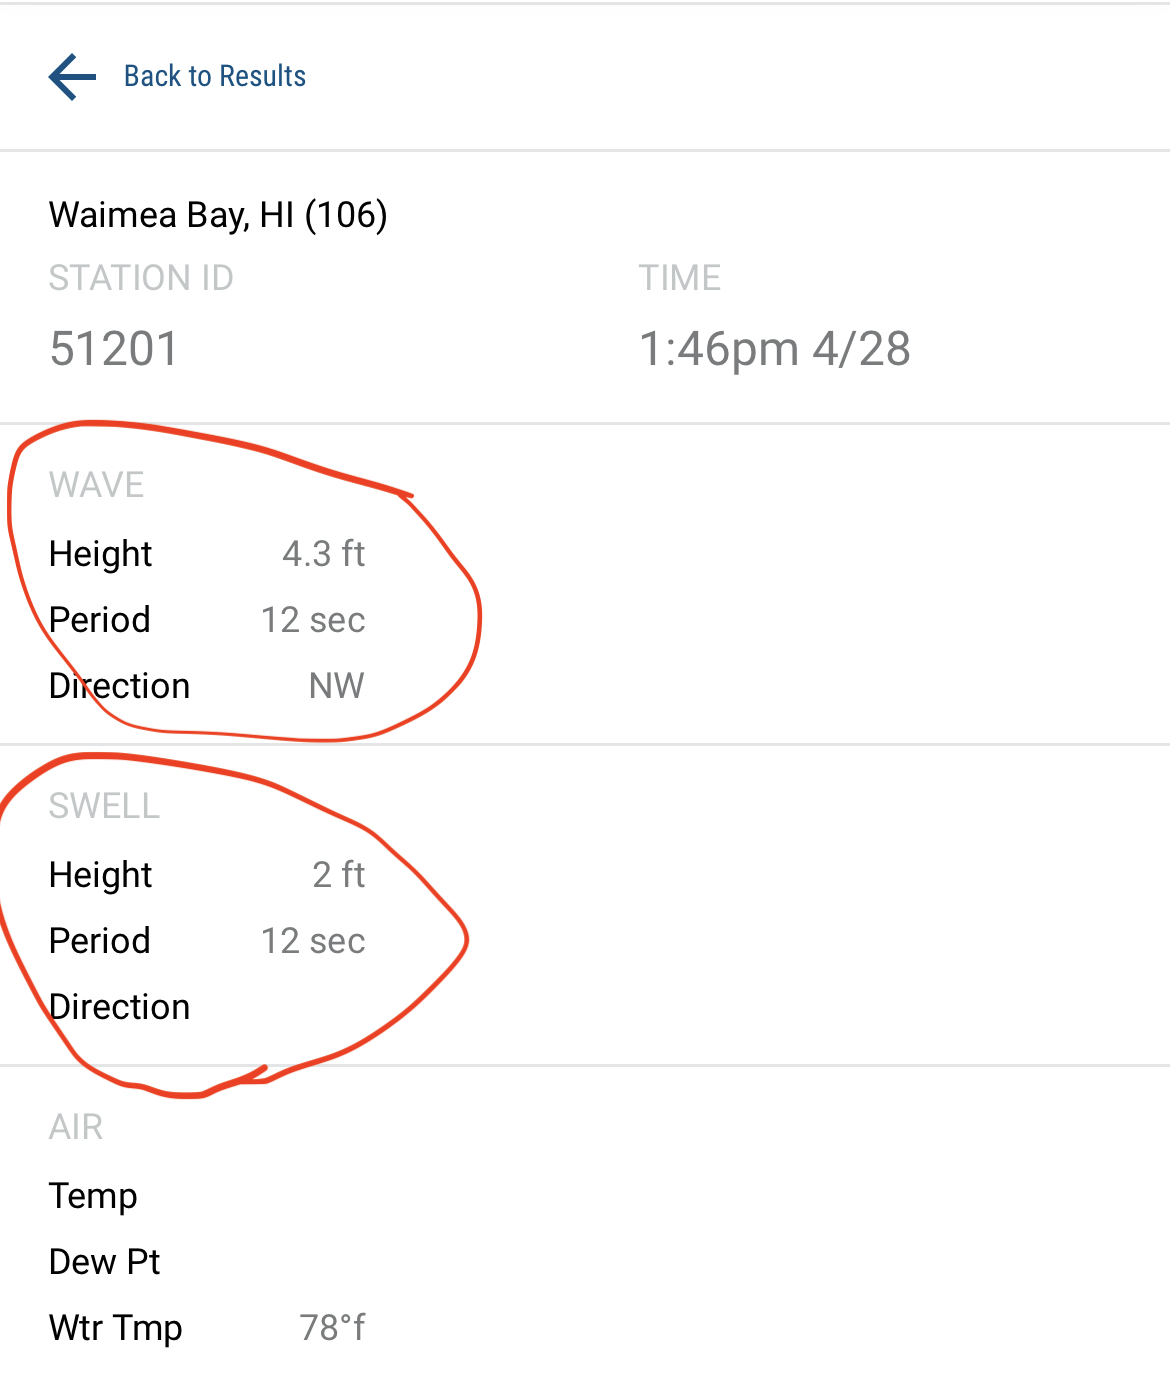
The most common values to observe from buoy data are the total significant height and the dominant period. These give a perspective of the entire wave spectrum, and this is what is reported on the top of the Surf Captain forecast pages.
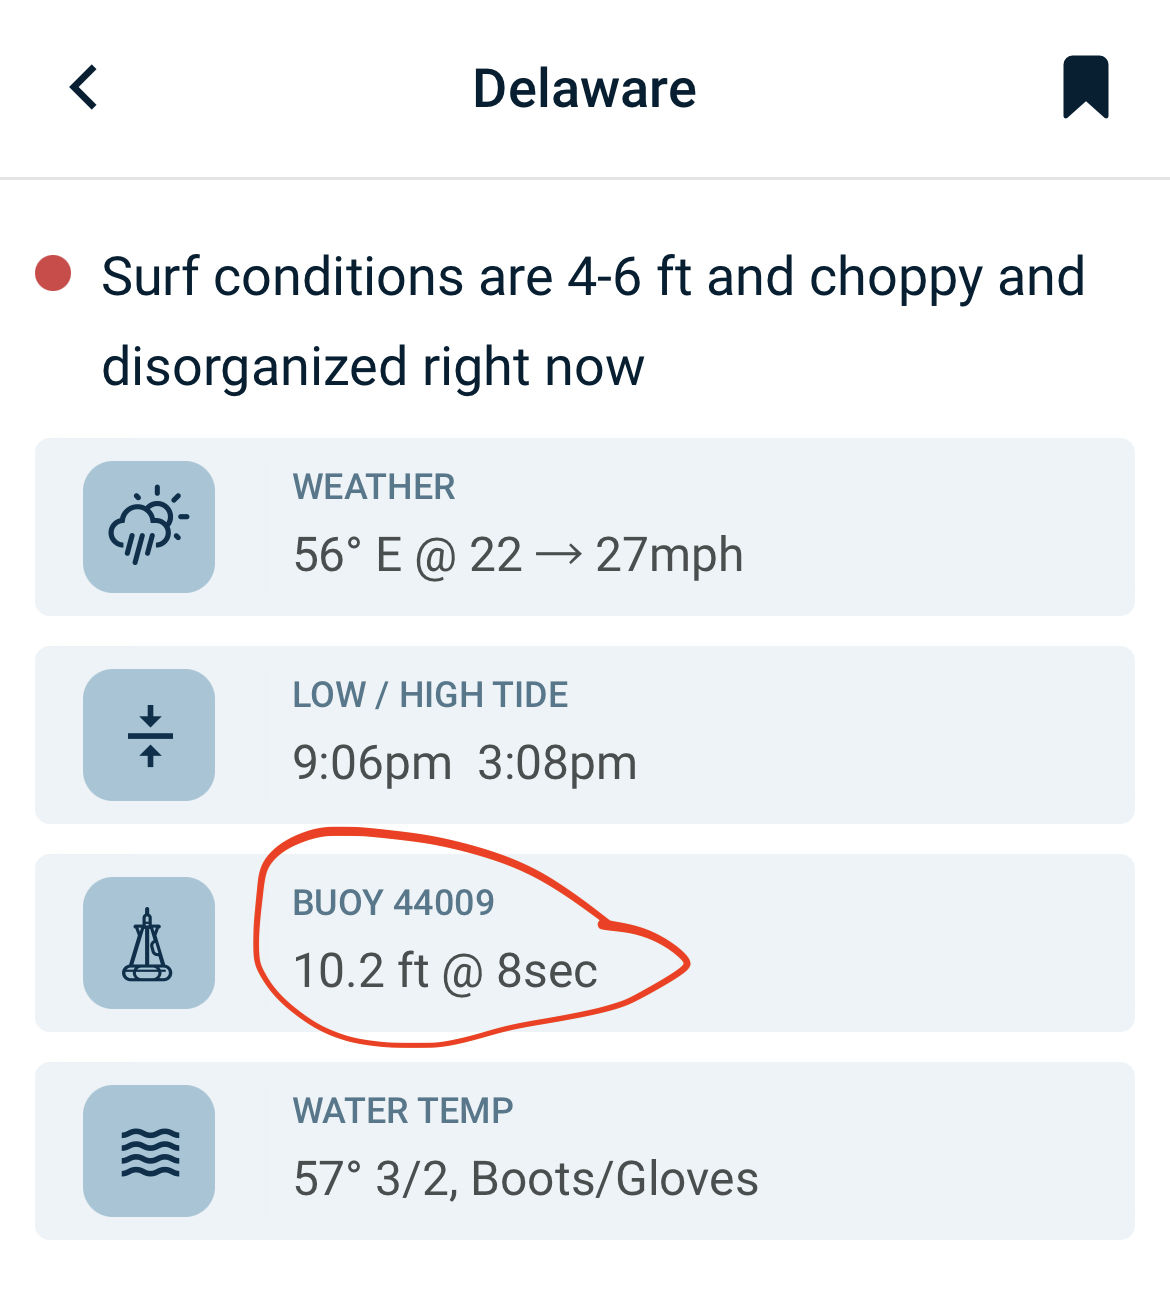
The significant wave height is the average height of the top third of all wave heights as measured from trough to crest. It is important to note that it is an average, so you can anticipate that waves can be both larger and smaller than this value. It is also valuable to understand that a bigger total wave height on the buoy does not necessarily mean the surf will be bigger at a specific break. This is because the wave height value is for the entire wave spectrum, which could contain different directions and periods (or frequencies). The signficant wave height, on its own, gives a limited view of the wave spectrum, but keep reading for more info on how to get a better view of the wave spectrum.
A bigger total wave height on the buoy does not necessarily mean the surf will be bigger
Wave period is the time it takes for a wave to pass from its wave trough or crest to the next trough or crest and is an important factor in anticipating how big the surf will be when the open ocean waves move towards the coast. In general, if wave height remains the same, the longer the wave period, the greater the surf height will be. Wind swells from nearby wind fields are generally in the 4 to 11 second range, and swells generated from distant storms are often in the 12 to 20 second range. The most powerful storm systems can generate wave periods greater than 20 seconds, and on rare occasions, get up to around 26 seconds. The wave period reported on the top of the Surf captain forecast is the dominant period of the wave spectrum. Together, the significant wave height and dominant period provide a nice first look at the buoy data. To get a better understanding of the wave spectrum reported from a buoy, you can look further into the swell height and period.
The signifiant wave height and dominant period provide a nice first look at the buoy data
Individual Swells
The NDBC breaks the wave spectrum down further to find the dominant swell. This means, of all the wave directions and frequencies, the dominant swell is the part of the wave spectrum that contains the greatest density of wave energy. This is reported as wave height (significant), period (dominant), and direction (average) of the dominant energy. On the Surf Captain station maps, you can view all buoys and see the significant wave height, and swell height:
Putting it all together with the forecast
When looking at the current day forecast, it is wise to compare the forecasted swells to nearby buoy data. The forecasted swells on Surf Captain are derived from the Surf Captain wave model at a particular latitude and longitude offshore. This location is generally around 3 -15 miles offshore. This can be compared to the nearby buoys, but note that if the buoys are far away from your location, you can see discrepancies between the two different locations. Keeping this in mind, comparing buoy swells with the Surf Captain forecast can give you an idea if the forecast is on target or under/over calling a particular swell.
As an example, if the Surf Captain forecast calls for a dominant swell of 3ft @ 14 seconds and the nearby buoy shows a swell height of 2.5ft @ 12 seconds, you can tell the forecast is over-calling this particular swell.
Comparing buoy swells with the Surf Captain forecast can give you an idea if the forecast is on target or under/over calling a particular swell.
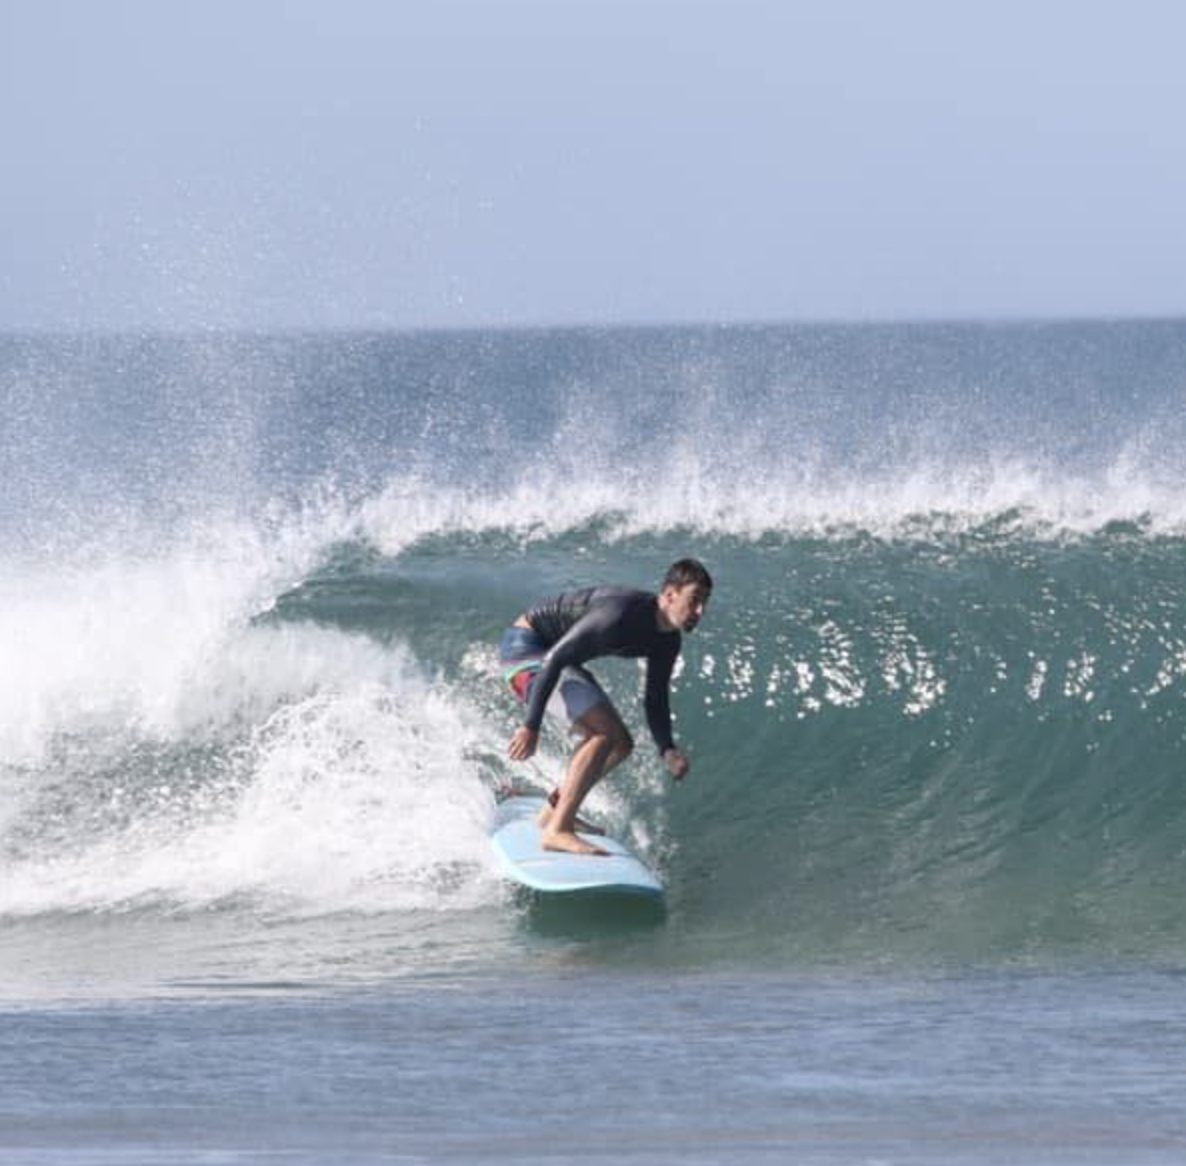
What about the surf height?
Until now, we have only talked about the heights of waves in the open ocean. As open ocean waves approach the coast, the wave interacts with the ocean bottom, becomes steeper and eventually topples over into a breaking wave. The ultimate size of the breaking wave has many factors and is unique to each individual surf break. At Surf Captain, we have developed our own algorithm that takes into account many characteristics of each local forecast area.
When you surf your local breaks, you can get tuned into what particular swell height, period, and direction work for your spots. For example, a common beach break with a swell of 3ft @ 13 seconds will be in the 3-4ft range. However, a particular inlet with the same swell size and period, for example, may focus wave energy from a particular direction and have bigger 5ft+ sets. Over time, having local knowledge of the breaks in your area and what wave height, period, and direction work for each break will help you score the best surf.