
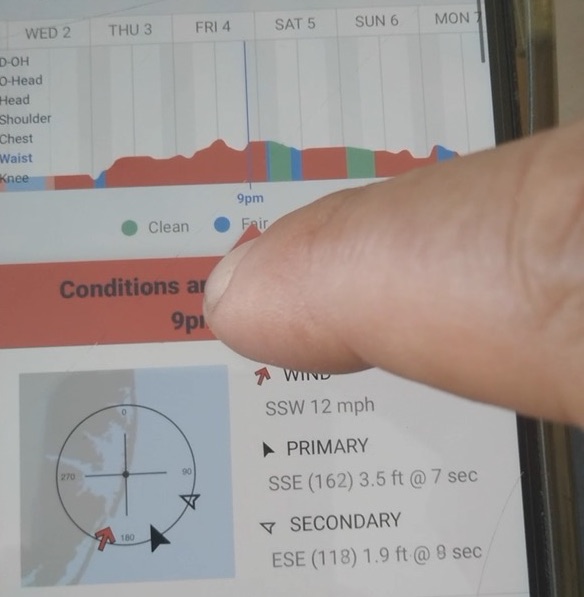
We are always looking to make improvements to Surf Captain, whether through the forecasting algorithms or small adjustments to the design and functioning of the user interface. A nice suggestion by a thoughtful user was to allow scrubbing through the forecast timeline graph without having to place your finger over top of the graph itself. We thought this was a great idea, so we added a slider over top of the conditions bar. You can scrub through the graph by touching or mousing over anywhere on the screen from the top of the graph to the bottom of the slider. Have a look at the video below for the demonstration.
We love hearing from our users, so if you have any suggestions to make Surf Captain better, please don't hesitate to let us know!