
As surfers, we are accustomed to talking about an upcoming swell or specifying a swell at a given wave height and wave period, but what does this really mean? To understand the forecast when Surf Captain predicts a swell at say 5ft @ 12 seconds, we need to take a step back to view a swell as a component of the entire 360 degree wave energy spectrum.
What the heck is a wave energy spectrum you may be asking yourself? Lets start off by forgetting everything you may have known about forecasting waves, and think about the last time you were surfing. You likely noticed a variety of different waves that came your way. Some waves were smaller, some were bigger, some came one right after another, and others came in from different directions. The entire variety of waves you encountered can be considered as the wave energy spectrum.
In Oceanography, we view the wave energy spectrum as a 360 degree view that includes the direction of the wave, along with its wave amplitude (wave height) and wave frequency (wave period). Wave energy at a particular location is generated by winds somewhere in the ocean that are pointing in the direction of that location. For example, a strong offshore wind will generate tiny waves moving toward you as you are surfing, say 50 ft off the coast, where as waves from a storm system hundreds or thousands of miles away will travel very far to reach your destination and have the potential to bring great wave amplitude and frequency.
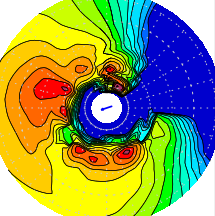
Wave Energy Spectrum Illustration for a location off of Hawaii
The image above shows the 360 degree wave energy spectrum for a location offshore of Hawaii, where North is at the top of the view. Longer period (high frequency) waves are closer to the center (25 seconds at the center), and the wave period gets shorter as you move away from the center (4 seconds on the outer edge). The colors dictate the wave energy, so the blue colors are less energy (or amplitude), and the darker yellows and red represent greater wave energy. You can tell from this illustration, that this Hawaii location is receiving wave energy from quite a wide range of directions and frequencies, except from the East/East-Northeast direction where there is an absence of wave energy.
As forecasters, showing this wave energy image is probably not the simplest way to convey the upcoming conditions. So, to make things easier, we use statistical approaches that take the entire wave spectrum and break it down into the mean wave fields, or what we refer to as swells, using the mean wave direction, frequency, and heights of a particular wave field. If you look closely at this image, you can see that there are 4 primary swells coming from the West-Northwest, South-Southeast, South-Southwest, and one from the North-Northeast. Perhaps these swells are summarized as a 5 ft WNW swell @ 15 seconds, a 4 ft SSW swell @ 18 seconds, etc.
At Surf Captain, we use the top 2 swell components for each location to comprise the surf forecast, but as you can see there can be much more going on in the ocean than these swell components. Using the example above, the 5 ft WNW swell @ 15 seconds is only a small portion of the wave energy spectrum, and we can see there will be waves coming from other wave directions, frequencies, and heights.
Hopefully this brief overview of the wave energy spectrum will give you a little more understanding of the wave forecast as well as understanding the variety of waves you may experience on your next surf session.